Networking
Begineer Friendly
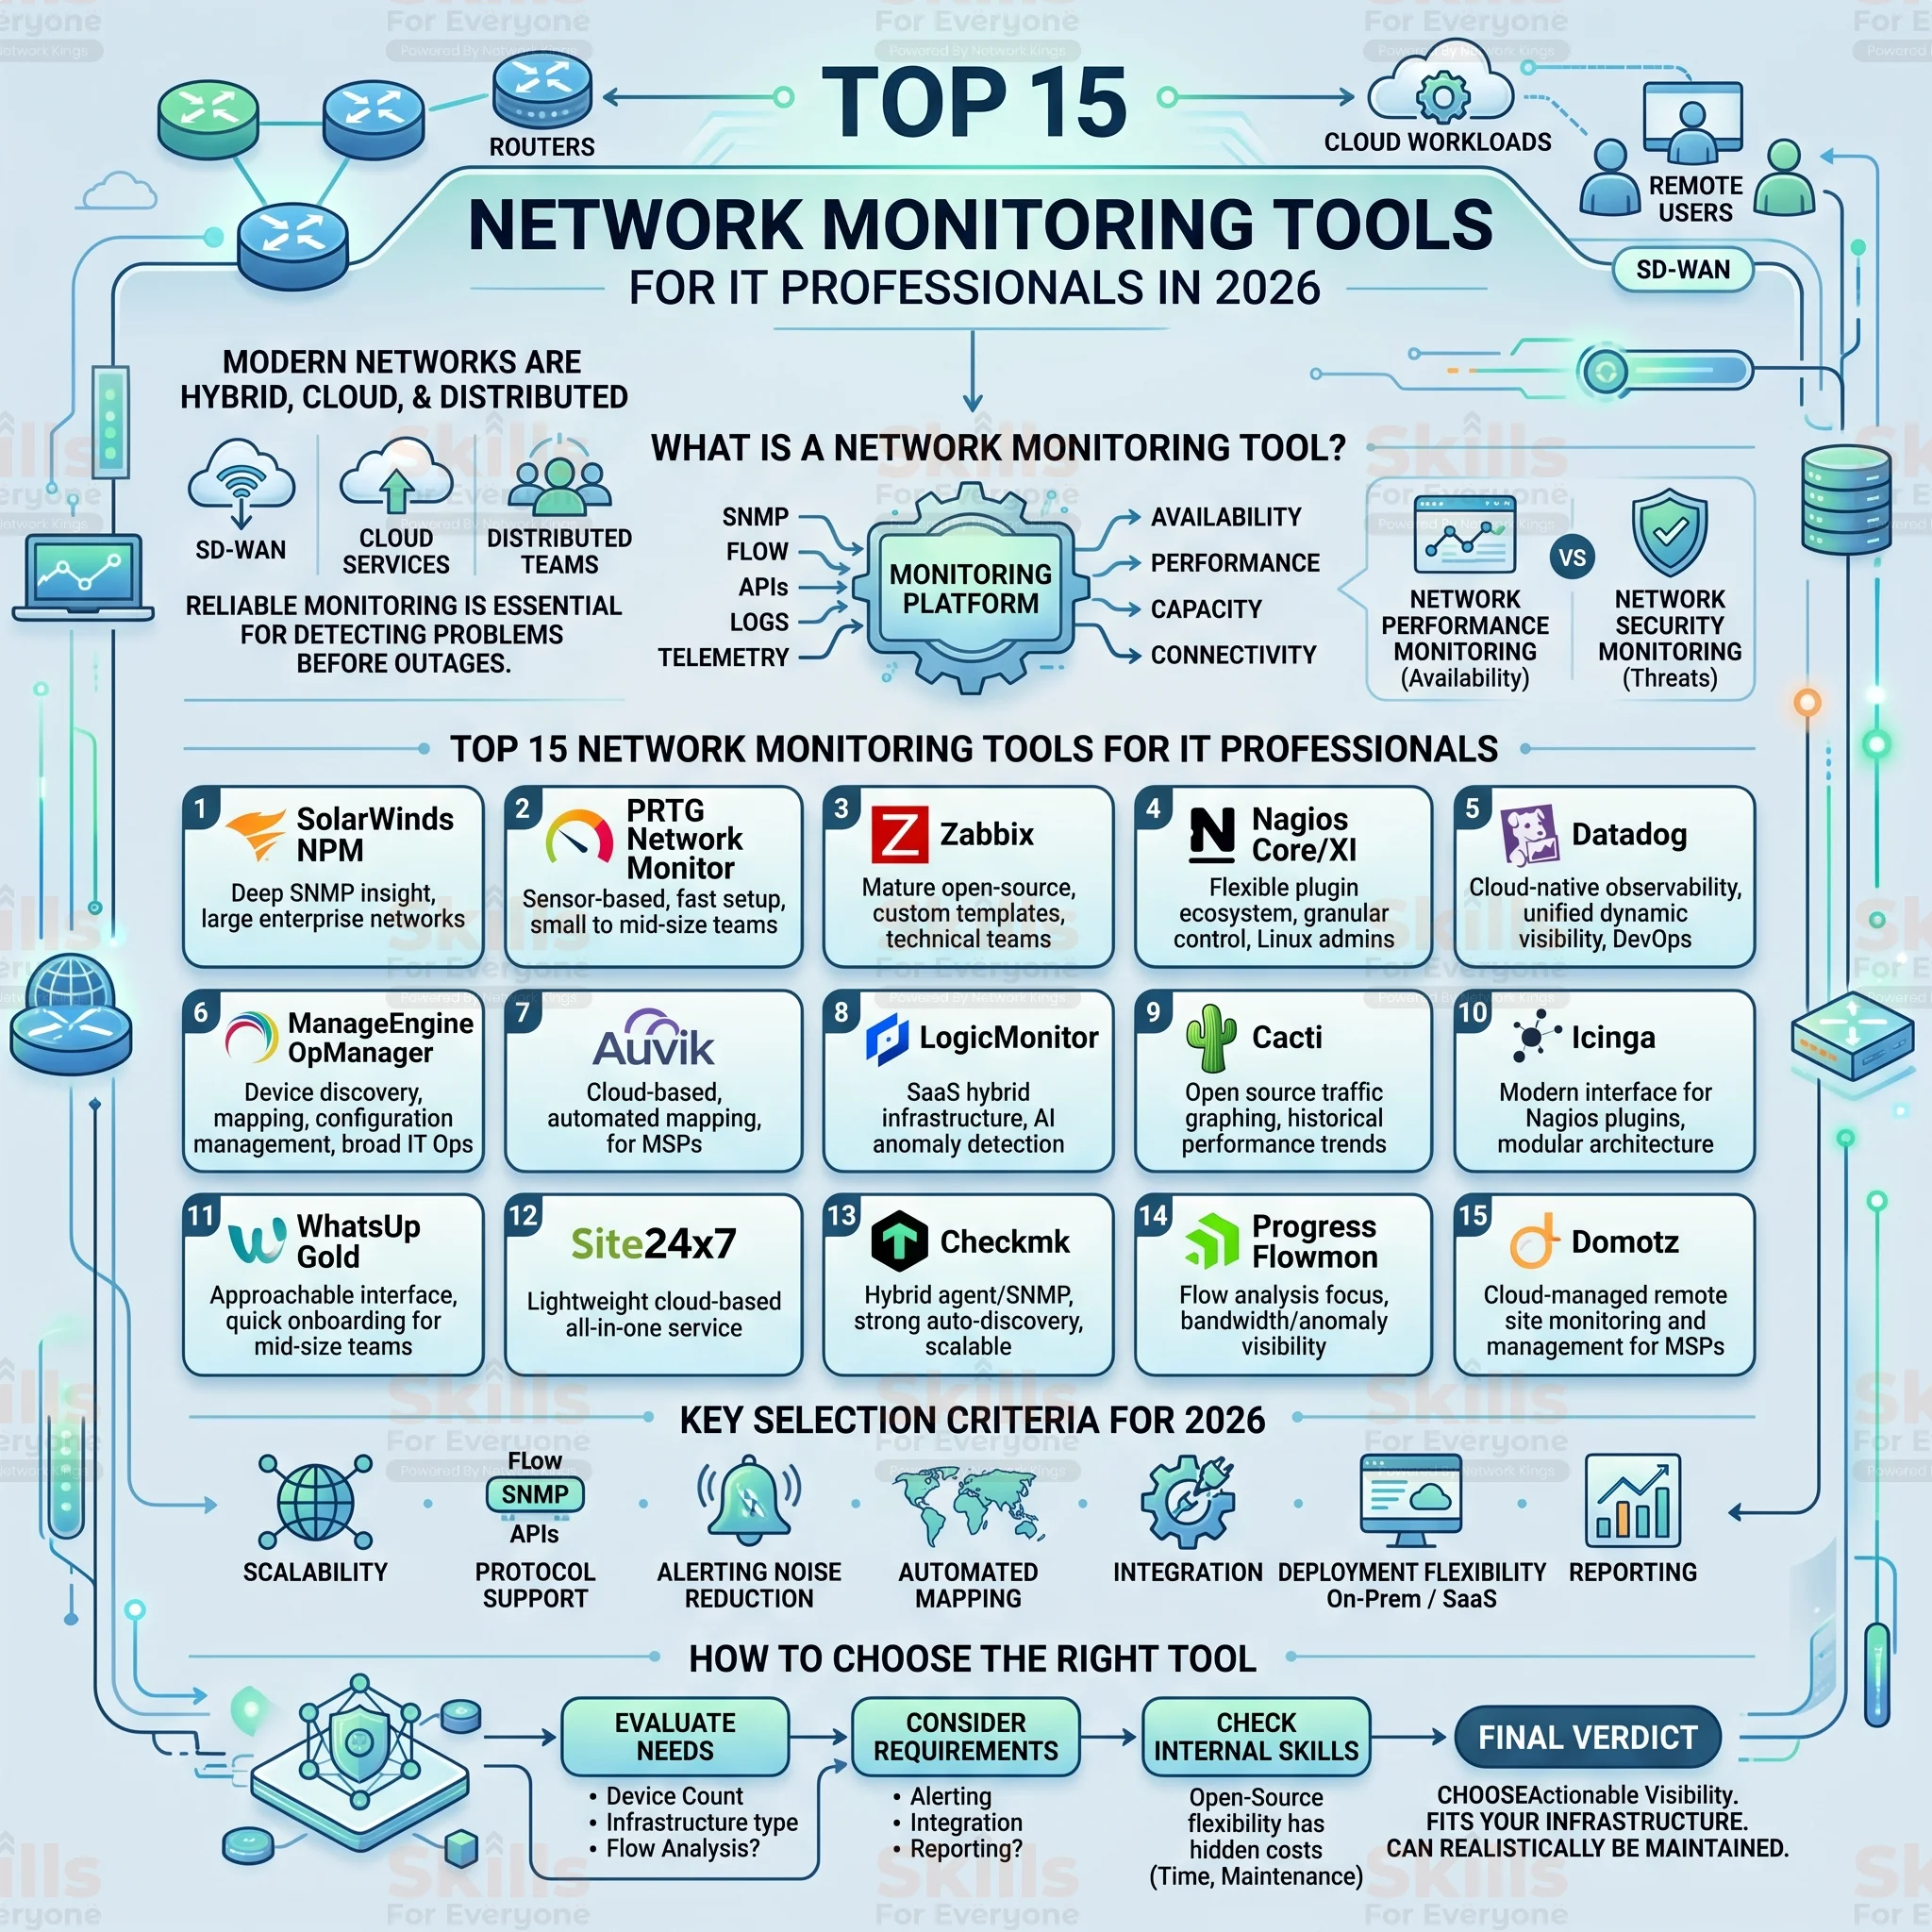
Modern networks are no longer limited to routers, switches, and servers sitting inside one data center. IT teams now manage hybrid infrastructure, cloud workloads, remote offices, SD-WAN, SaaS applications, and distributed users. That makes reliable network monitoring essential for detecting performance problems before they become business-impacting outages.
The best network monitoring tools in 2026 do more than show whether a device is online. They can collect SNMP metrics, analyze traffic, map infrastructure, monitor network paths, generate alerts, and connect network performance with applications and cloud services. Current industry comparisons also show a growing overlap between traditional network monitoring, observability, and digital experience monitoring.
What Is a Network Monitoring Tool?
A network monitoring tool continuously collects and analyzes information from network infrastructure to help IT teams understand availability, performance, capacity, and connectivity.
Common technologies include SNMP, flow data, APIs, ICMP, logs, and telemetry. A good monitoring platform can help identify high bandwidth utilization, interface errors, latency, packet loss, device failures, and unusual behavior.
Network monitoring is different from network security monitoring. Monitoring primarily focuses on availability and performance, while security monitoring concentrates on threats, suspicious activity, and security events. In practice, organizations often use both.
What to Look for in Network Monitoring Software in 2026
Modern environments span on-premises hardware, cloud workloads, and hybrid connections, so evaluation criteria have broadened beyond basic uptime checks:
Scalability across thousands of devices without excessive polling overhead
Support for SNMP, NetFlow/sFlow, syslog, and API-based cloud monitoring
Alerting that reduces noise rather than adding to alert fatigue
Automated network discovery and mapping
Integration with ticketing, automation, and observability platforms
Deployment flexibility, whether on-premises, SaaS, or hybrid
Reporting suited to both technical teams and management
Top 15 Network Monitoring Tools for IT Professionals
1. SolarWinds Network Performance Monitor. A long-established on-premises platform known for detailed SNMP-based monitoring, customizable dashboards, and NetPath visualization. Its strength is depth of device-level insight for Windows-centric enterprise IT teams. Licensing scales with device count, and deployment complexity increases with large environments, so verify current pricing with the vendor.
2. PRTG Network Monitor by Paessler. PRTG uses a sensor-based licensing model covering bandwidth, uptime, and application checks in one unified dashboard. It suits small and mid-sized IT teams that want fast setup without heavy configuration. Larger networks can hit sensor limits that push costs up quickly.
3. Zabbix. A mature open source platform supporting SNMP, agent-based, and agentless monitoring with strong customization through templates and triggers. It fits technical teams comfortable with configuration and scripting, particularly those avoiding recurring license fees. The tradeoff is a steeper learning curve and self-managed infrastructure.
4. Nagios Core / Nagios XI. One of the original open source monitoring frameworks, Nagios remains popular for its plugin ecosystem and flexibility. Nagios Core suits experienced Linux administrators who want granular control, while Nagios XI adds a commercial interface layer. Initial configuration can be time-consuming compared to newer platforms.
5. Datadog. A cloud-native observability platform combining infrastructure, application, and network monitoring with strong integrations across cloud providers. It is well suited to DevOps and cloud-first teams needing unified visibility across dynamic, containerized environments. Costs can rise significantly as data volume and host count increase, so usage should be modeled carefully.
6. ManageEngine OpManager. A network and IT infrastructure monitoring tool offering device discovery, mapping, and configuration management in one package. It appeals to mid-sized organizations wanting broader IT operations coverage beyond pure network metrics. Feature depth varies across pricing tiers, so confirm what's included at each level.
7. Auvik. A cloud-based network monitoring and management platform built around automated network mapping and configuration backup. It is particularly popular with MSPs managing multiple client networks remotely. Being SaaS-only, it depends on reliable outbound connectivity from monitored sites.
8. LogicMonitor. A SaaS-based infrastructure monitoring platform with broad out-of-the-box integrations and AI-assisted anomaly detection for identifying abnormal performance patterns. It fits enterprises and MSPs needing hybrid cloud and on-premises visibility without managing monitoring infrastructure themselves. As a subscription platform, long-term costs should be weighed against on-premises alternatives.
9. Cacti. An open source tool focused on graphing network traffic and performance data via RRDtool and SNMP polling. It suits technical teams that primarily need reliable historical trend graphing rather than full alerting workflows. Its interface and alerting capabilities are more limited than newer platforms.
10. Icinga. Originally forked from Nagios, Icinga offers a more modern interface and modular architecture while retaining plugin compatibility. It fits organizations that want open source flexibility with easier ongoing maintenance than Nagios Core. Advanced features often require additional modules and configuration.
11. WhatsUp Gold. A network monitoring platform from Progress Software offering discovery, mapping, and alerting with a relatively approachable interface. It is a reasonable fit for small to mid-sized IT teams wanting quicker onboarding than more complex enterprise suites. Advanced scalability features are typically reserved for higher-tier licenses.
12. Site24x7. A cloud-based monitoring service covering network devices, servers, websites, and applications from a single dashboard. It suits smaller IT teams and MSPs wanting a lightweight SaaS option without on-premises infrastructure. Deep, granular network diagnostics are less extensive than specialist on-premises tools.
13. Checkmk. An open source and commercial hybrid tool combining agent-based and SNMP monitoring with strong auto-discovery. It appeals to technical teams wanting open source flexibility with an optional enterprise support tier. The free edition has scaling limitations that may require upgrading for larger deployments.
14. Progress Flowmon. Focused on network traffic analysis using NetFlow and IPFIX data, Flowmon adds strong visibility into bandwidth usage and traffic anomalies. It is well suited to security-conscious enterprise teams needing deep flow-level analysis alongside standard monitoring. It works best paired with a broader monitoring platform rather than as a standalone solution.
15. Domotz. A cloud-managed network monitoring tool built for remote monitoring and management, popular among MSPs and IT service providers. Its strength is straightforward remote deployment across distributed client sites. Feature depth for large enterprise networks is generally lighter than dedicated enterprise platforms.
Comparison Table
Tool | Best For | Deployment | Key Strength | Open Source | Best Use Case |
SolarWinds NPM | Enterprises | On-premises | Deep SNMP device insight | No | Large Windows-centric networks |
PRTG | Small/mid-size | On-premises/hybrid | All-in-one sensor monitoring | No | Fast setup, unified dashboard |
Zabbix | Technical teams | On-premises | Custom triggers and templates | Yes | Budget-conscious flexible monitoring |
Nagios | Technical teams | On-premises | Plugin ecosystem | Yes (Core) | Granular custom monitoring |
Datadog | Cloud/DevOps | SaaS | Unified observability | No | Dynamic cloud environments |
ManageEngine OpManager | Mid-size | On-premises/hybrid | Broad IT ops coverage | No | Network plus infrastructure ops |
Auvik | MSPs | SaaS | Automated network mapping | No | Multi-client remote management |
LogicMonitor | Enterprises/MSPs | SaaS | AI-assisted anomaly detection | No | Hybrid infrastructure visibility |
Cacti | Technical teams | On-premises | Traffic graphing | Yes | Historical performance trends |
Icinga | Technical teams | On-premises | Modular open architecture | Yes | Nagios alternative with easier upkeep |
WhatsUp Gold | Small/mid-size | On-premises | Approachable interface | No | Quick onboarding |
Site24x7 | Small teams/MSPs | SaaS | Lightweight all-in-one | No | Cloud-first monitoring |
Checkmk | Technical teams | On-premises/hybrid | Strong auto-discovery | Yes (with paid tier) | Scalable hybrid monitoring |
Progress Flowmon | Enterprises | On-premises/hybrid | NetFlow traffic analysis | No | Deep bandwidth and anomaly visibility |
Domotz | MSPs | SaaS | Remote site monitoring | No | Distributed client networks |
How to Choose the Right Network Monitoring Tool
There is no single best network monitoring tool for every organization. A small IT team may prioritize simple deployment and predictable administration, while an enterprise network team may need advanced topology, flow analytics, distributed monitoring, automation, and long-term capacity planning.
Before selecting a platform, evaluate:
Number and type of devices
On-premises versus cloud infrastructure
SNMP and telemetry requirements
Need for flow analysis
Alerting and escalation capabilities
Integration with ITSM and automation platforms
Reporting and historical data requirements
Internal skills available to operate the platform
Licensing and total operational cost
Open-source tools such as Zabbix, Checkmk, and OpenNMS can provide significant flexibility, but the software license is only one part of the total cost. Engineering time, maintenance, upgrades, integrations, and troubleshooting also need to be considered.
For enterprises, platforms such as SolarWinds, LogicMonitor, Datadog, Dynatrace, IBM SevOne, and Kentik can be attractive when broader visibility and scalability justify the additional investment. The right choice ultimately depends on whether the priority is traditional network performance monitoring, cloud observability, traffic intelligence, digital experience, or a combination of these approaches.
Final Verdict
The best network monitoring tools in 2026 are increasingly moving beyond simple uptime checks. IT professionals need visibility into devices, interfaces, traffic, network paths, applications, cloud environments, and user experience.
For traditional network monitoring, SolarWinds NPM, ManageEngine OpManager, and PRTG remain strong options. Auvik is particularly relevant for MSPs and multi-site environments, while Zabbix, Checkmk, and OpenNMS provide attractive choices for teams seeking open-source flexibility. Datadog and Dynatrace are better aligned with broader observability strategies, while ThousandEyes and Kentik address specialized visibility and network intelligence needs. These distinctions are reflected across current 2026 industry comparisons.
The most important lesson is simple: do not choose a monitoring tool based only on the number of features it lists. Choose the platform that gives your team the right visibility, produces actionable alerts, fits your infrastructure, and can realistically be maintained as the network grows.
Here are 8 SEO-friendly FAQs you can add to the article. They target common informational queries without making the FAQ section feel keyword-stuffed.
FAQs
1. What is a network monitoring tool?
A network monitoring tool is software that continuously tracks the availability, performance, and health of network devices and connections. It can monitor routers, switches, servers, interfaces, bandwidth, latency, packet loss, and other infrastructure metrics.
2. Which network monitoring tool is best in 2026?
There is no single best network monitoring tool for every organization. SolarWinds NPM, LogicMonitor, PRTG, ManageEngine OpManager, Datadog, Auvik, Zabbix, and other platforms suit different environments. The right choice depends on network size, deployment model, monitoring requirements, budget, and internal technical expertise.
3. What features should you look for in network monitoring software?
Important features include SNMP monitoring, network discovery, topology mapping, bandwidth analysis, real-time alerts, performance dashboards, historical reporting, cloud monitoring, integrations, automation, scalability, and support for hybrid infrastructure.
4. Are there free or open-source network monitoring tools?
Yes. Zabbix, Checkmk, and OpenNMS are examples of open-source network and infrastructure monitoring platforms. They can reduce software licensing costs and provide extensive customization, although organizations may need more technical expertise to deploy, configure, and maintain them.
5. How do network monitoring tools work?
Network monitoring tools collect performance and availability data from network devices using technologies such as SNMP, ICMP, flow data, APIs, logs, and telemetry. The platform analyzes this information and generates dashboards, reports, and alerts when predefined thresholds or unusual behavior are detected.
6. What is the difference between network monitoring and network security monitoring?
Network monitoring primarily focuses on network availability, performance, connectivity, and capacity. Network security monitoring focuses on identifying suspicious activity, threats, and security events. Many organizations use both because performance problems and security incidents can affect network availability.